It is difficult sometimes to predict where the market might go. Forex traders struggle with this every day. Traders have made many solutions to this problem, the main being trends. As they say “a trend is your friend”, by following trends you have a better chance of earning from your trade. What is a trend, how can I follow it, and how is it identified are questions that may come to mind. We will be answering all these questions so you can use trends to achieve your trading goals.
What is a Trend in Forex
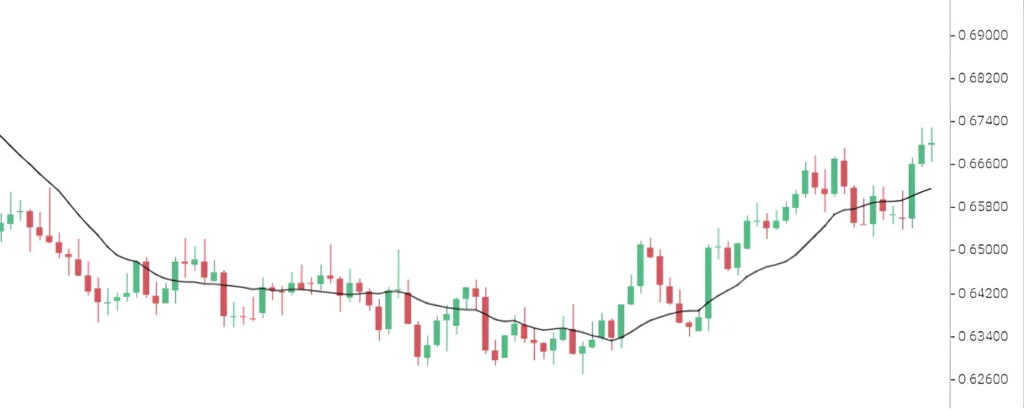
A Trend is a general direction of the market. The direction the market takes can be divided into three ways. It is either upwards (bullish), downwards (bearish) or sideways (flat). There are higher highs and higher lows when the trend is upward. You can see that each top is taller than the one before it, and each bottom is taller too. An upward trend is most likely to carry on in that direction.
Lower highs and lower lows are common during downtrends. A closer look reveals that every top is lower than the one before it, and every bottom is lower than the one before it. The decline is expected to carry on in the same direction, just like uptrends do.
The market does not go up or down when it is not trending. Instead, it veers to the side. If you look closely, you will find that a sideways market has roughly equal highs and lows. It is also possible to refer to this sideways motion as a range. A range is more likely to break out above or below the horizontal pattern than it is in an uptrend or downtrend.
How to Identify a Trend in Forex
To identify a trend you can watch the price movement of a forex chart. The information you get from the candlesticks is enough to understand the market direction. This movement is known as price action. When the candlesticks become higher than the prior ones, in both the highs and lows, you can assume that it is an uptrend. On the other hand, if the candlesticks make lower highs and lower lows, this is a downtrend. The picture below can further explain how candlestick movement can help identify trends.
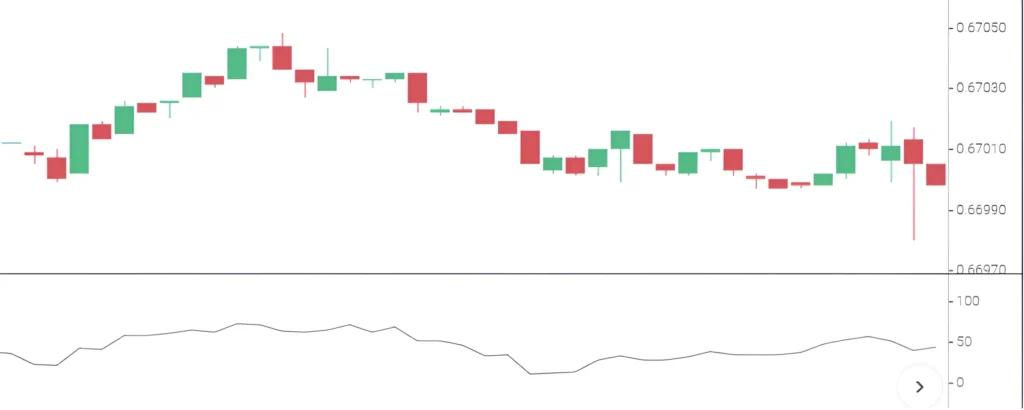
The price can also move horizontally which is known as a flat movement. The highest point from this movement is called the resistance line. The lowest point is called the support line. Together they make a range. When the price goes out of this range it is known as a breakout. Breakout trading is widely used in the forex market such as the London breakout. When the price breaks out of the resistance line it indicates an uptrend. However, when it breaks out the support line it indicates a downtrend happening. The image below makes this concept more clearer.
Different trends do not necessarily have to conflict with one another and may exist together. This implies that trends within trends are a possibility. Any underlying asset does not have a single right trend unless it is analyzed over a specific period. When you zoom in to shorter timeframes, like hourly or 30-minute charts, the trend may appear to be declining even though the daily chart of the underlying asset might indicate that it is rising.
Trend Indicators
Technical indicators are used in many forex strategies. Indicators help the trader identify where the market might head in the short or long future. Trend indicators can be used by traders to predict whether trends will persist or change direction. Of course, no single technical indicator may lead to financial success. Additionally, traders need to have a defined risk management plan and trading mentality. Even so, trend indicators could be quite useful for both day traders and amateur investors. The following are the top trend indicators in Forex.
Moving averages
Moving averages are the most used indicator in forex. They smooth out the price, helping with price fluctuation in the market. Moving averages can be applied in multiple situations, including reversals. Moving averages are most frequently used in trend trading. A trend trader will employ this indicator when it is added to a chart and the trade is kept for as long as the price is above or below the moving average. Moving averages can be simple, smoothed, or hull, for instance. Moving average indicators are a common feature of online platforms and brokers’ charting tools.

Bollinger Bands
Standard deviation and moving averages are used to create the sort of indication known as Bollinger Bands. The top and lower lines of the indicator stand for standard deviations, while the middle line indicates the moving average over a certain time frame. The moving average is typically 20 and the standard deviation is typically 0.2.
Trend-following methods are where Bollinger Bands are most frequently used. The price almost usually remains between the middle and upper lines of the indicator during an upswing. Therefore, the goal is to buy as long as the price is between these two lines. However, sell signals arise when the price is situated between the lower and middle lines. A negative trend will be strong when the price is moving in the direction of the bands’ bottom line.
Stochastic Oscillator
A popular indicator for spotting overbought and oversold levels is the stochastic oscillator. Two lines are combined to form this indication, the percent D and percent K lines. Additionally, it aids traders in recognizing the top and lower bands (80 and 20 respectively).
Sell signals appear when the two lines cross above the higher band, and buy or purchase indications appear when the two lines cross below the lower band. As long as the two lines are pointing in the same direction, a bullish trend would continue after the crossover, and vice versa. Stochastic oscillators are not present in all trading platforms. However, many of the most popular ones display them on their charts.
Relative Strength Indicator
The Relative Strength Index (RSI) is the most popular oscillator indicator used in the financial industry. This indicator determines the momentum of several assets, including stocks, currencies, and exchange-traded funds. It is common practice to utilize the Relative Strength Index to identify overbought and oversold levels. An asset is seen as being highly overbought when its price has been rising for a considerable amount of time.
In many markets trend traders frequently use the RSI indicator. Buy signals occur when the indicator keeps moving upward, and sell signals occur when it keeps moving downward. Relative strength index indications are typically offered as an indicator choice through online trading platforms, just like moving averages.

Price Action
Price action in trading looks at the past performance of an asset, index, or commodity to predict future performance. If one’s price action analysis suggests that the price will increase, one might wish to buy the item or short it if they anticipate that the price will decline.
Price action indicators are bursts of activity that appear on a trading chart and signal the beginning of a trend. Experienced traders can spot these indications quickly and use them to make informed real-time market bets. Price action patterns or triggers, are easily recognizable market patterns that can be used to predict future market behavior. Sometimes experienced traders can spot these signs at a glance by identifying specific patterns or repeats in prior performances.
Effectively Utilizing Trends
To effectively trade trends and consistently be successful you can’t only rely on identifying the trend. Determining when to exit with minimal losses is key to succeeding in trend trading. Price goals would be great when using channels while trading on trendlines and raw price action. Channels are parallel trendlines that are constructed with care to keep the price movement inside their boundaries. Target placement works well in channels. For instance, the top line in an uptrend signifies locations where the price may start to retrace or decrease, and this would be a suitable level to close a Buy order.
Stop-loss orders, on the other hand, can close your position when prices move against you, shielding you from further losses. Stop-losses are a vital instrument in risk management since they guard against severe losses. Using a stop-loss method has the drawback of occasionally locking you out of a position that would have been successful if you had not closed it. This means that choosing the ideal stop-loss positions is crucial.
In the Forex market, traders can use a variety of stop-losses, including standard stop-losses and trailing stops. Standard stop-losses work best in unpredictable markets, such as those that fluctuate during news releases. When the predetermined price is reached, they will close out your position. On the other hand, moving stop-loss orders placed below or above the market price are known as trailing stops. Since they lock in earnings as prices move in your favor, they are perfect for trading trending markets.
Conclusion
A trend in Forex is when the price moves in a certain pattern. This pattern can help the trader know when the market might rise, drop, or even move in the same direction. Identifying a trend is not difficult especially when you get used to it. Technical indicators are also used to further increase your chances of reading a trend right. To be successful while trend trading in forex you must know when to exit a trade. Leaving a position open for too long can cost you all the earnings made from that trade and even more. In all a trend in Forex is very useful for many reasons. To constantly be successful and improve your trading, always practice proper risk management.


