As crypto trading grows in popularity, an ever-expanding number of analysts and forecasters attempt to determine the short-term patterns driving this unpredictable sector. While impossible to perfectly time, technical indicators offer a structure for analyzing Bitcoin, Ethereum, and other digital currencies’ frequently volatile price action.
This article explores the most effective indicator combinations and strategies proven helpful by experienced CFD traders. By understanding these tools and how to interpret their signals, you’ll gain valuable insight into tactical opportunities amid crypto’s whipsawing trends.
Moving Averages – Filtrating Noise From Trends
Moving averages (MA) are among the most basic yet instructive indicators available. Their smoothed price lines filter short-term fluctuations to expose the underlying trend’s direction and strength much like a measuring tape’s flexible edge captures an object’s contours.
On crypto charts, the most commonly referenced MAs include the 50, 100, and 200 periods. Traders watch for crossovers like price penetrating above a longer-term average, signaling an upward trend shift. They also look for support/resistance of major averages – bounces indicating potential reversals.
By combining multiple periods, MA gives both a short- and long-term perspective. For example, the 50 crossing above the 100 signals a potential medium-term bull continuation. Pairing these views meaningfully directs well-timed entries and appropriate duration holds.
MACD – Momentum Revelations
The moving average convergence divergence (MACD) momentum indicator shines a particular light on crypto’s explosive price action. Its integration of multiple MAs reveals oscillations in buying and selling pressure often preceding significant trend accelerations.
When MACD lines cross above zero after being deeply negative, a bullish signal signals that a coin may surge higher. Traders can enter long CFD positions hoping to make returns. Conversely, a MACD crossover below zero warns of momentum flattening then a bearish – point for protective stops or shorts.
Monitoring divergences like when MACD swings opposite price also offer clues. Negative divergences often precede corrections, while positive mark end-of-bear rallies potentially fuel fresh euphoric advances. Overall MACD provides multidimensional outlooks for timing deployment of capital.
RSI – Overbought And Oversold Reversals
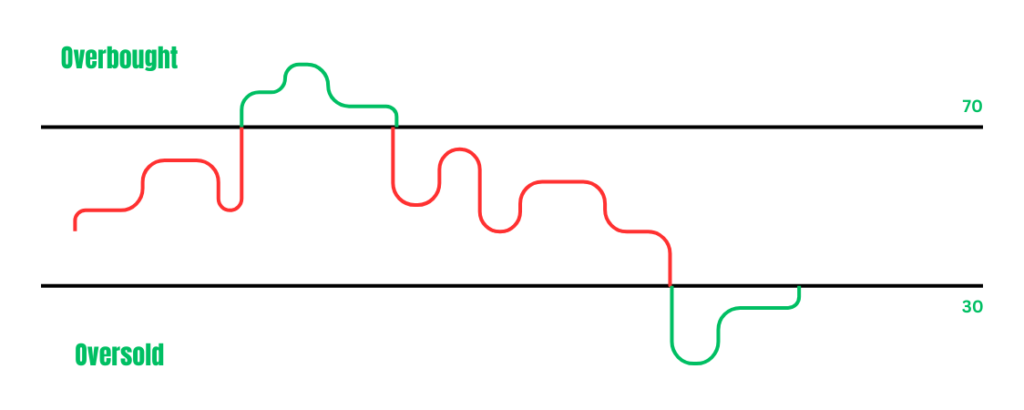
Relative strength index (RSI) detects when crypto prices start becoming statistically overextended from typical ranges. Like a rubber band stretched to its limits, heavily overbought or oversold extremes often signal imminent reversals are approaching.
RSI levels under 30 warn of terminally bearish conditions rising in the short term. Alternatively, over 70 indicates overheated upswings vulnerable to healthy pullbacks. With practice, traders learn when cues suggest exits or resets rather than moving back and forth.

Strategies incorporate waiting for confirmation like a down candle after the RSI reaches extremes. Due to this, necessary patience is put in among infrequent volatility, preventing impulsive reactions and even capturing important countermoves. In summary, RSI helps identify possible reversal zones for entries at lower risk.
Bollinger Bands – Ranging Trends In Focus
By calculating a simple moving average and plotting standard deviations above and below as price channels, Bollinger Bands effectively portray when crypto ranges tighten or widen. Consolidating ranges signal building pressures, indicating that outbreaks could erupt suddenly
Watch as candles squeeze between tightening bands. This often precedes a “BandBust” – a sharp move exploding beyond the upper or lower line. Traders can catch these breakouts for potentially extended directional moves, exiting at the first retest of breached boundaries.
Conversely, wide bands imply flat trading, a lack of strong sentiment, and subsequent range-bound price action. Avoid chops by sidestepping fades until bands tighten again. In all Bollinger Bands acquire discipline waiting for high-conviction setups.
Stochastic Oscillator – Overbought/Oversold Confirmation
The stochastic oscillator measures investors’ momentum by plotting %K and %D lines evaluating where closing prices sit relative to a security’s trading range. As such, it confirms overbought/oversold signals spotted first by tools like RSI.
Crypto CFD traders watch for stochastic lines curling below 20 and topping 80. Indicating extreme readings poised to bounce, these levels act as triggers for entries into reversals. Traders can short overbought or long oversold instances expecting normalizing mean-reversion back towards 50.
Pairing stochastic with RSI proves doubly insightful. For instance, seeing both tools flash overbought lets traders become highly confident in liquidating longs. Conversely tailoring entries to confirmation from multiple angles enhances confirmation amid fluctuating volatility. Over time it cultivates well-rounded technical discernment.
Conclusion
When aiming for successful crypto trades, analysts understand no single crypto indicator can hold all the answers. Their most successful strategy combines many viewpoints to triangulate strong trading signals and prudently manage exposure across both whipsaws and trends. Constantly gaining experience with tools like moving averages, MACD, RSI, Bollinger Bands, and stochastic oscillators provides important information worthwhile for extracting value from digital currency derivatives worldwide.


