The financial industry has undergone an evolution thanks to cryptocurrencies, which have given traders and investors new opportunities for investing. Trading in the cryptocurrency market may be difficult and unpredictable, though, as prices are vulnerable to changes.
Understanding the many indications that may be used to forecast market movements and make wise trading decisions is crucial for becoming a successful crypto trader. We will examine the top 8 indicators for trading cryptocurrencies in this article, offering details on how they operate and how you can use them to enhance your trading approach.
What Are Crypto Indicators?
A trading indicator is an instrument that uses market data to forecast the trend of an asset. To assess whether the trend is bullish, bearish, or neutral, indicators use mathematical formulas for momentum, volume-driven data, or previous price action.
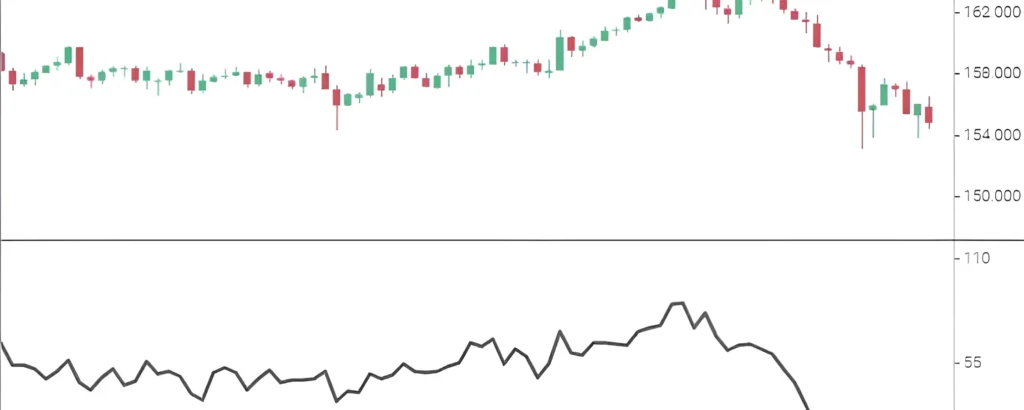
The Relative Strength Index (RSI) is a popular illustration of a trading indicator. Based on how many shares were purchased or sold, this indication determines an asset’s strength. Overbought is a term used to describe the upper end of the RSI range (>70), while oversold is a term used to describe the lower end (30). An asset will change its course and trend in the opposite way when it reaches either range.
Lagging indicators examine previous market activity and its underlying factors (for example, moving averages). You can trade the asset assuming the same result if comparable conditions show up on the chart.
Leading indicators, like the stochastic oscillator, forecast future price movement by examining momentum. When trying to determine whether an asset is overextended, you can trade implementing leading indicators.
Overlays and oscillators are two further types. Oscillator indicators are located underneath the price chart and have a minimum and maximum range, as described in the RSI. Some traders look for divergences by comparing oscillator numbers and price action.
The Importance of Indicators in Crypto
By giving traders insightful information about market patterns and price changes, indicators play a significant role in cryptocurrency trading. To assist traders in spotting market patterns, trends, and future price reversals, these tools employ mathematical calculations and statistical analysis. Traders can increase their earnings and reduce their losses by employing indicators to help them decide when to enter or quit a trade.
Making informed decisions based solely on intuition might be difficult for traders because bitcoin trading is so unpredictable and volatile. Using indicators, traders can examine market patterns objectively and make wise judgments based on data and statistics.
Relative Strength Indicator (RSI) | Indicators For Trading Crypto
An oscillator indicator called the Relative Strength Index (RSI) indicates oversold and overbought market circumstances. An asset enters an oversold phase when investors panic and sell it too aggressively, which is when buyers arrive. When investors make such large purchases of an asset, the reverse occurs. To validate one of the two scenarios, RSI examines momentum.
The value of the RSI indicator varies from 0 to 100. When the RSI is above 70% an asset is overbought and below 30% is considered oversold. Anything in the middle is OK. The market views 50% RSI as a neutral area, but assets may respond to it.
Remember that during an uptrend, RSI frequently taps the 70% RSI level. During trending phases, the indicator tends to be fairly incorrect. It’s unusual for the RSI to hit 70% during a decline. The asset might change its direction if something unusual occurs.

Pros and Cons of RSI
Since the Relative Strength Index (RSI) is a commonly used and well-liked technical indicator, it has the benefit of making it simple for traders to access information and instructions on how to apply it efficiently. Furthermore, the RSI can clearly show traders whether an asset is overbought or oversold, which can aid them in making wise trading decisions.
The RSI does have one drawback, though: it may be difficult for new traders to comprehend it, and may take some skill and expertise to apply it effectively in bitcoin trading. Traders can decide whether to enter or quit a trade and maximize their earnings in the volatile world of cryptocurrency trading by learning how to apply the RSI along with other indicators and analysis tools.
Bollinger Bands | Indicators For Trading Crypto
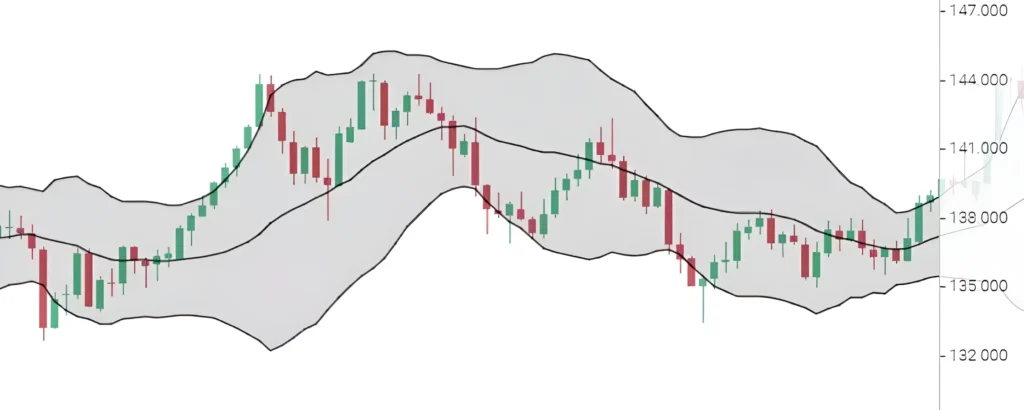
Bollinger bands, named after the technical analyst who created them, John Bollinger, are a technical indication for the price and volatility of a crypto asset over time. A simple moving average (often the 20-period SMA), an upper band, and a lower band that is typically two standard deviations apart from the SMA make up their three primary parts. The difference between a group of values or prices from the average value or price is calculated as the standard deviation.
In this regard, the standard deviation will provide a low value that implies minimal volatility if prices are in a small trading range, making it an excellent indicator of volatility. The upper Bollinger band represents the positive standard deviation. This region indicates that the underlying price is increasing in an unusual way, which is a strong indication that it might be overbought.
The negative standard deviation is represented by the lower Bollinger band. This region indicates that the underlying price is declining abnormally, which is a strong sign that it might be oversold. The bands are widening, which indicates that the market is getting more volatile as prices depart from the trailing 20 MA. The market may become less erratic as bands close.

MACD | Indicators For Trading Crypto
One of the most widely utilized tools by cryptocurrency traders is the moving average convergence divergence indicator (MACD), which is a useful simple momentum indicator for buying or selling. When the MACD diverges, the two underlying moving averages are moving apart, and when it converges, they are moving in the same direction.
It is known as a trend-following momentum indicator, which means that it will provide signals for both a trend and momentum (the likelihood for rising asset prices to rise further and declining prices to keep falling). It is intended to show alterations in the strength, direction, momentum, and length of a trend in the price of a cryptocurrency.
The difference between a short-term and a more extended period of exponential moving averages is the MACD indicator. In crypto, the 12 and 26-period EMAs are frequently taken into account. The MACD line, which can provide appealing buy or sell indications, is the product of those calculations. It is a good opportunity to buy if the MACD is positive and above 0, which suggests an upward (bullish) momentum. If it is negative and has a downward (bearish) momentum below 0, it is an ideal time to sell.
Traders can also determine how strong a given trend is by examining the MACD chart. For instance, there is a considerable likelihood that the markets will soon enter a downtrend if the chart shows higher highs but the MACD shows lower highs. This is because the price is rising but the momentum is declining. Since they evaluate momentum through various parameters, the MACD and RSI are typically used in conjunction with one another.
Pros and Cons of MACD
The ability to quickly and easily spot trends and possible buy or sell signals is one of the key benefits of employing MACD in bitcoin trading. In order to fit their trading strategy, traders may also customize it by changing the time frame and the amount of sensitivity. The MACD can occasionally offer misleading indications, like any indicator, so traders should utilize additional indicators in addition to the MACD to validate their findings.
Moving Averages | Indicators For Trading Crypto
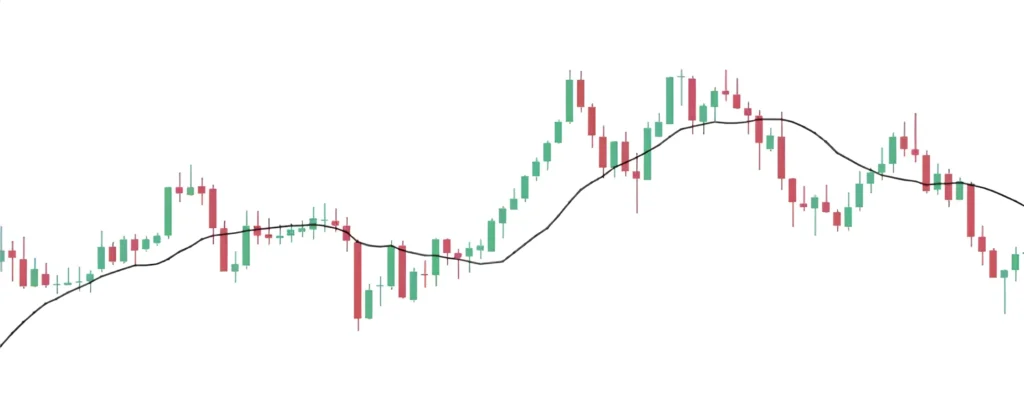
Simple Moving Averages (SMA), often known as moving averages, are lines drawn over a chart and are generated using average price data collected over a certain period. The 21 MA (21-day moving average), for instance, creates a line based on the average value of the price movement over the preceding 21 days.
The MA range can be modified in any way you choose. But for low time frames(LTF) and high time frames(HTF), correspondingly, the norm is to employ 7-day and 25-day MAs and 50-day and 200-day MAs.
To determine support and resistance levels, the majority of traders combine a number of Moving Averages. Traders buy an asset at a level when it is trading slightly above an MA because they think it might hold. Similarly, traders may want to start a short position at an HTF MA level that is above the asset in the hopes that it would serve as resistance.
The moving average calculates its value by taking into account additional factors alongside the average price of a recent sample of candles. The best moving averages, according to the calculation method, are:
- Weighted Moving Average
- Simple Moving Average
- Exponential Moving Weight

Pros and Cons of Moving Averages
The fact that moving averages are lagging indicators means that they frequently reveal trends that have already begun on the charts. This is one of their main drawbacks. This is because moving averages are formed using historical price data, which contains few predictions. As a result, trends support and resistance levels, and other signals provided by moving averages may be slower, and one may also notice that the market doesn’t always appear to obey these levels. This occurs more frequently when prices are choppy and the market is struggling to maintain a trend.
Aroon Indicator | Indicators For Trading Crypto
Another technical analysis technique for identifying possible trend alterations and trend strength in bitcoin trading is the Aroon Indicator. The Aroon Up line and the Aroon Down line are its two lines. The Aroon Up line tracks the time frame since the cryptocurrency’s peak price, whilst the Aroon Down line tracks the time frame since its lowest price. The lines move back and forth between 0 and 100, with values above 50 signaling a strong uptrend and below 50 signaling a strong downtrend.
Pros and Cons of Aroon Indicator
The Aroon Indicator is a flexible tool that may be modified depending on unique trading preferences and styles. To better suit their trading strategy and increase the indicator’s accuracy, traders can alter the time frame and sensitivity of the tool.
The Aroon Indicator does have one drawback, though, which is that it can often give contradictory signals when the market is fluctuating or consolidating.
Fibonacci Retracement | Indicators For Trading Crypto
Trading professionals frequently utilize Fibonacci retracement levels to spot price-turning moments in cryptocurrencies. With this tool, traders can place more reasonable Cryptocurrency trades, which could lower potential losses. Hidden levels of the horizontal lines of support and resistance known as Fibonacci retracements indicate probable price reversals for Cryptocurrencies. The major levels are 23.6, 38.2, 61.8, and 78.6 percent.
The Fibonacci retracement is taken from the Italian mathematician Fibonacci sequence, which appears in both nature and mathematics. They are employed by traders in the financial industry when examining a price chart to identify probable turning points.
The Fibonacci retracement is applied to a prior trend and can be expressed as a percentage. The retracement demonstrates the extent to which the prior trend will likely be reversed before it resumes. The Fibonacci retracement tool transforms the percentage into the price of Bitcoin to pinpoint potential market turning points and trends.
Pros and Cons of Fibonacci Retracement
A quick and efficient method for traders to identify possible market support and resistance levels is the Fibonacci Retracement. In order to fit their trading strategy, traders may also customize it by changing the time frame and the amount of sensitivity.
Fibonacci retracement levels are arbitrary, and traders may employ alternative ratios or time frames, which might result in signals that are in contradiction.
Stochastic Oscillator | Indicators For Trading Crypto
The stochastic oscillator is a widespread technical tool for spotting overbought and oversold cryptocurrencies, which can help traders decide when to enter and leave a trade. The stochastic oscillator is one of the most well-known and often utilized technical indicators in the cryptocurrency market. The range value is in the range of 0 to 100.
The stochastic oscillator can be used by cryptocurrency traders in the same way that it is used when trading traditional assets. The highly volatile nature of cryptocurrencies makes it possible for traders to optimize their trading tactics by providing clarity on market conditions.
A stochastic oscillator is a preferred trading indicator because it helps traders recognize changes in trends more precisely. For instance, if the oscillator is rising upward, the price of the security may also be trending upward, and the other way around. This can assist traders in making better choices regarding when to acquire and sell their assets. The stochastic oscillator can assist traders in identifying potential divergences between the price of the cryptocurrency and the oscillator in addition to trend changes. For instance, if the oscillator is heading downwards while the price of the cryptocurrency is trending higher, this may suggest that the price of the asset is likely to restore itself soon.
On-Balance Volume (OBV) | Indicators For Trading Crypto
The market’s purchasing and selling pressure is measured by on-balance volume (OBV). When an asset’s price grows, its volume is added to the OBV; similarly, when its price lowers, its volume is subtracted from the OBV. The OBV line then swings back and forth towards a zero line, giving traders a clue as to the intensity and trajectory of the trend.
Pros and Cons of On-Balance Volume (OBV)
In cryptocurrency trading, the On-Balance-Volume (OBV) indicator can be used to validate trends and spot possible divergences between the indicator and the price of an asset. A probable trend reversal can be identified by traders using OBV when an asset’s price is moving in one way while the volume is going in the opposite direction. OBV can also be combined with other technical analysis tools to limit the danger of false signals and confirm trading signals.
Utilizing the OBV indicator has the drawback that it could not be appropriate in all market circumstances. OBV functions best in markets that are trending and when there is obvious purchasing or selling pressure.
Conclusion
The great advantage of crypto indicators is that they give us a clearer picture of where the market is right now and where it might be going. With the use of indicators, you may apply mathematical procedures that determine support and resistance levels and show market data. However, because people, not machines, trade the financial markets, these price levels are not always adhered to. As a result, you cannot completely rely on signs and expect that their results will be accurate.


